
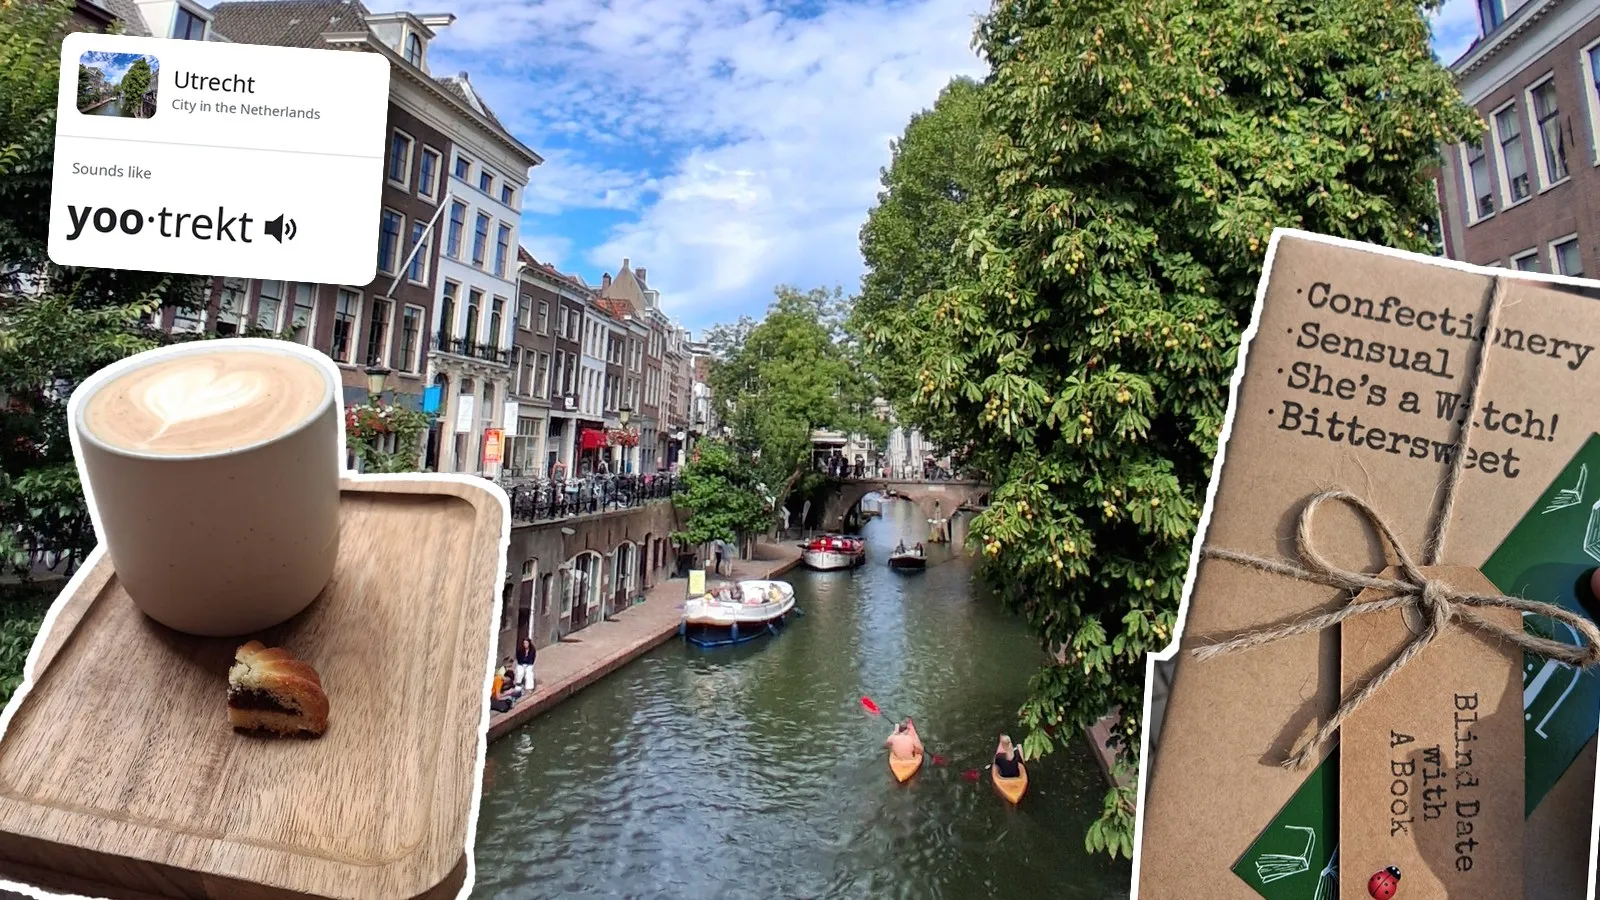
I was fortunate enough to attend the European Meteorological Society’s Annual Meeting in Utrecht, the Netherlands, alongside around 800 others (+ Boris and Haneen from Maths & Stats!).
Aside from the research itself, the week involved many coffees and a lot of calendar Tetris trying to optimise my attendance. I came home with a better feel for my own work and a long list of conference tips, especially for presenting.
Networking
Myself, Boris, and Haneen were having lunch in a restaurant one day, when a stranger came over and asked if he could join us. He admitted that he just wanted to skip the long queue outside, but we ended up getting on and crossing paths several times throughout the conference. I want to apply this kind of minimalist thinking when networking in future.
Presentations
I made a conscious effort to write down what I liked and didn’t like about the talks, for when I eventually give my own:
- Don’t rely on presenter notes or animations working on the day. A few people kept a notebook with their notes as a backup.
- A lot of the questions were about (1) the underlying dynamics of the models, (2) why a particular assumption had been made, or (3) what a result actually meant physically.
- I saw many speakers lose track of where they were when they couldn’t figure out the clicker, so I’ll be testing mine before I start.
- I got left behind in abbreviation station in a lot of talks. There are only so many I can process at once!
- If you have to race through everything, there’s probably too much there. I’d rather walk away understanding one simple message than hear about five cool but rushed things.
- I loved it when people left their conclusions and a QR code to their paper up as the final slide. It gave everyone plenty to work with in the Q&A. Some skipped straight to a blank thank-you slide instead (see Death to the Thank You Slide). Beware that some people’s QR codes didn’t work or had been deactivated. Chrome makes one for free if you right-click the page and choose Create QR code for this page (thanks Oisín).
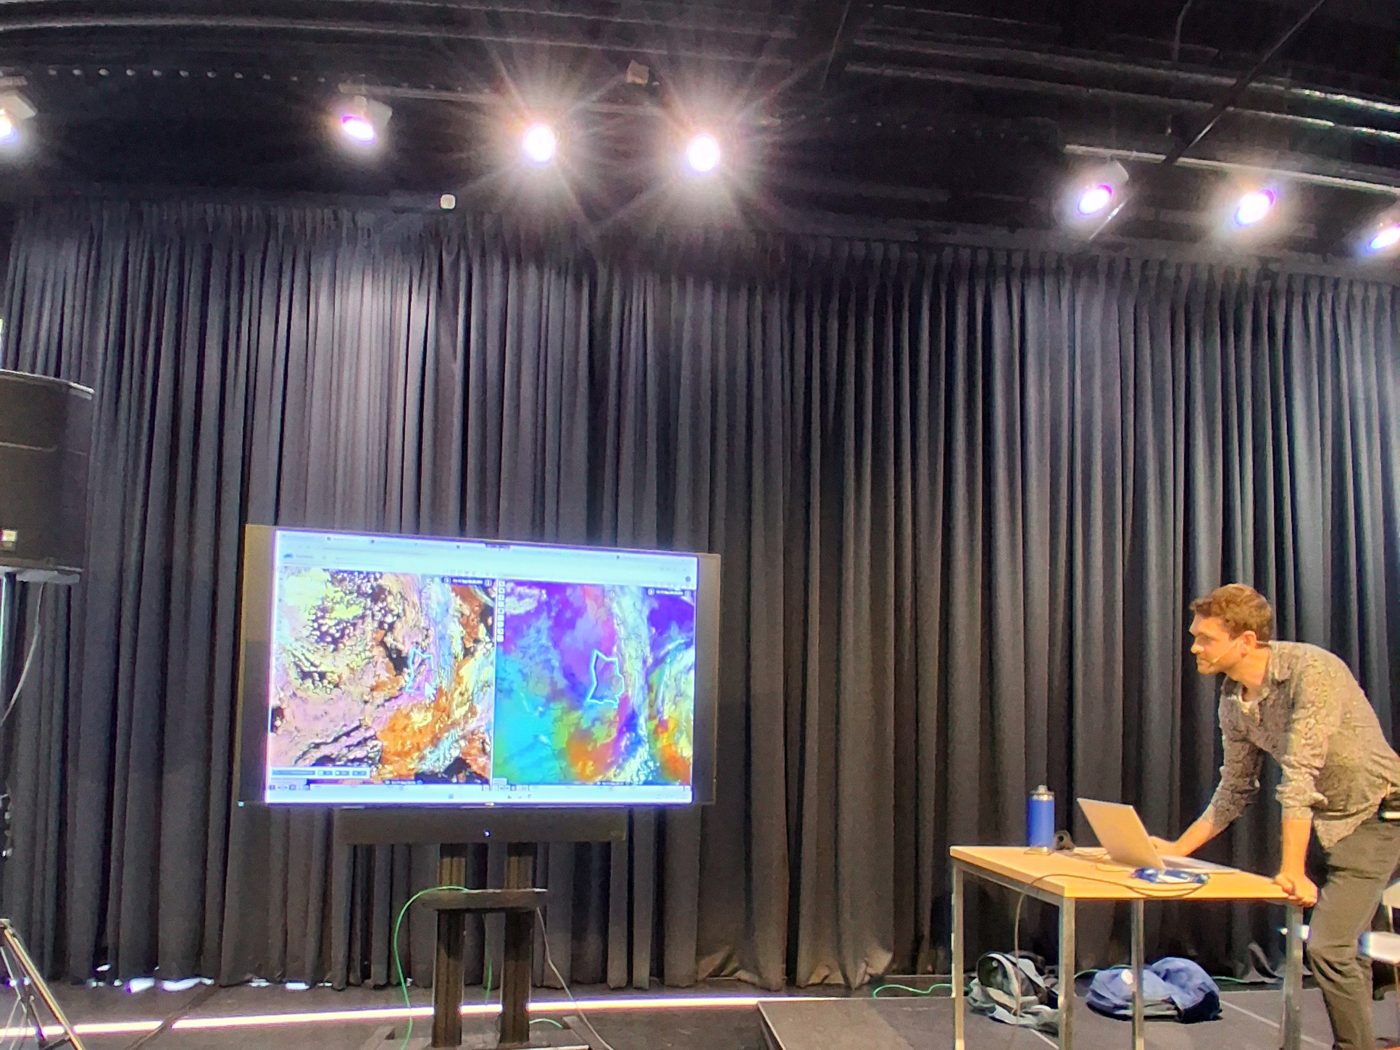
I also got to see Boris give a brilliant talk, although I was too invested in the second-hand nerves to remember to take a photo :(
Poster
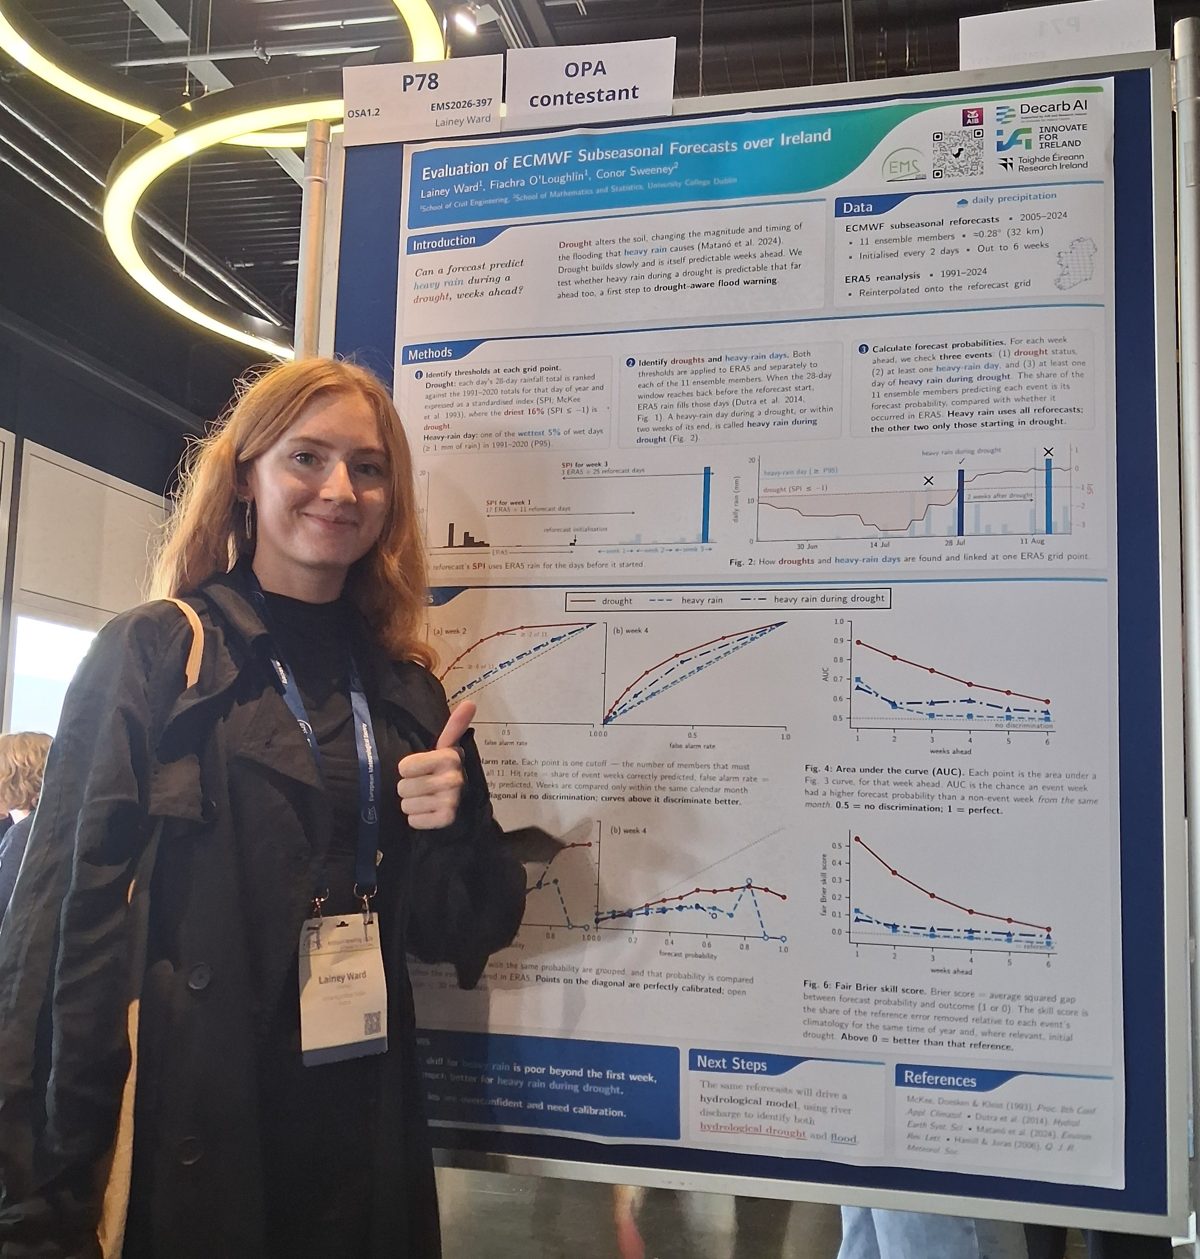
Despite starting mine over a month in advance, I still made my final edit only a week before the conference. By then, I had missed the deadline to have it printed for collection in Utrecht, which resulted in me hiding a poster tube under my trench coat on the flight. It was Aer Lingus, but years of Ryanair baggage fees have left me with PTSD (Poster Tube Smuggling Disorder).
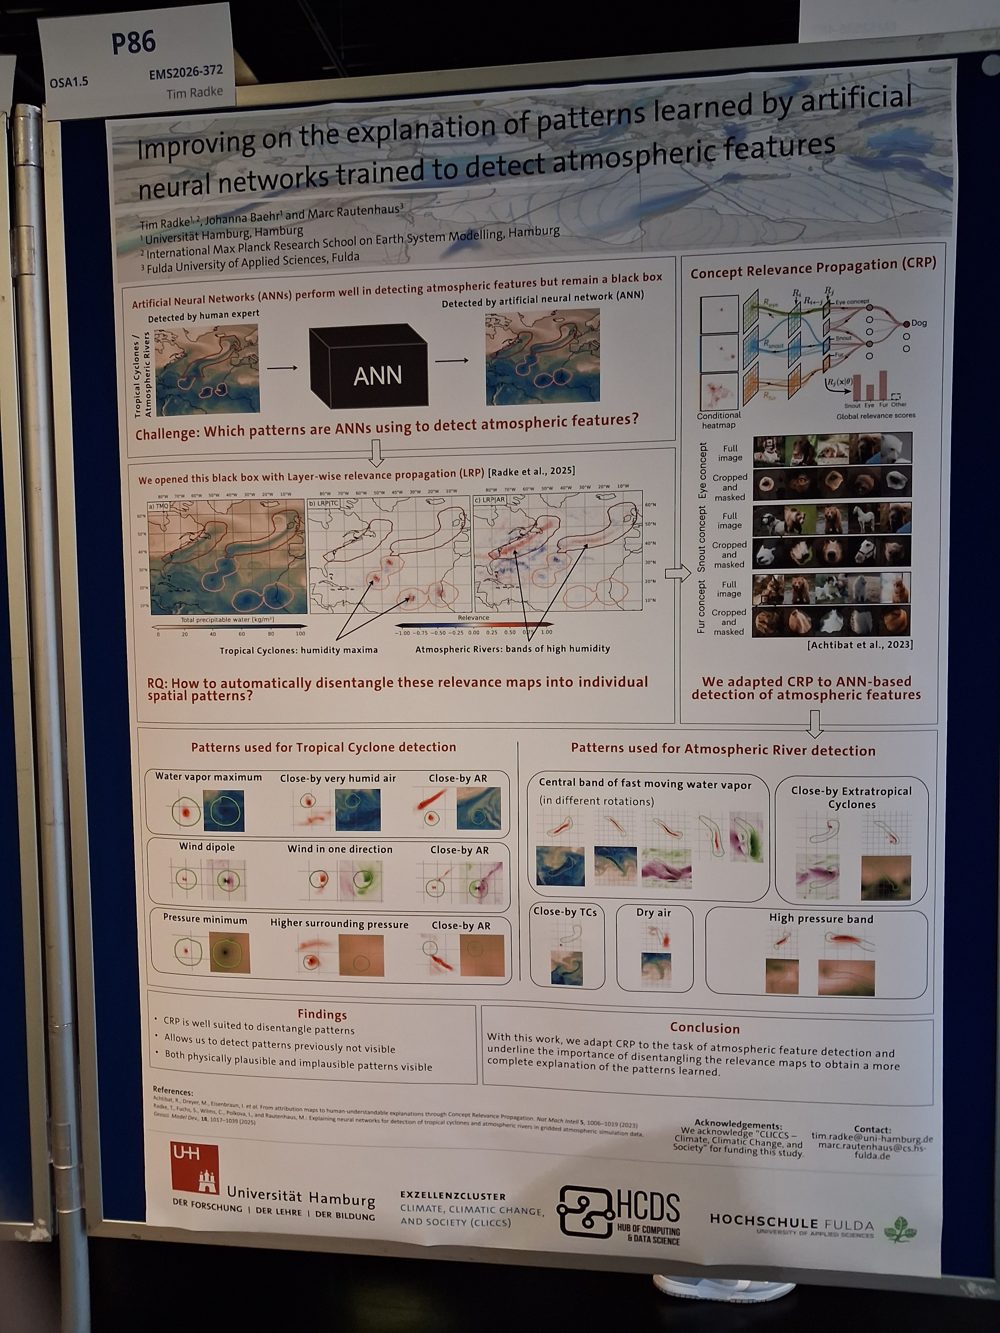
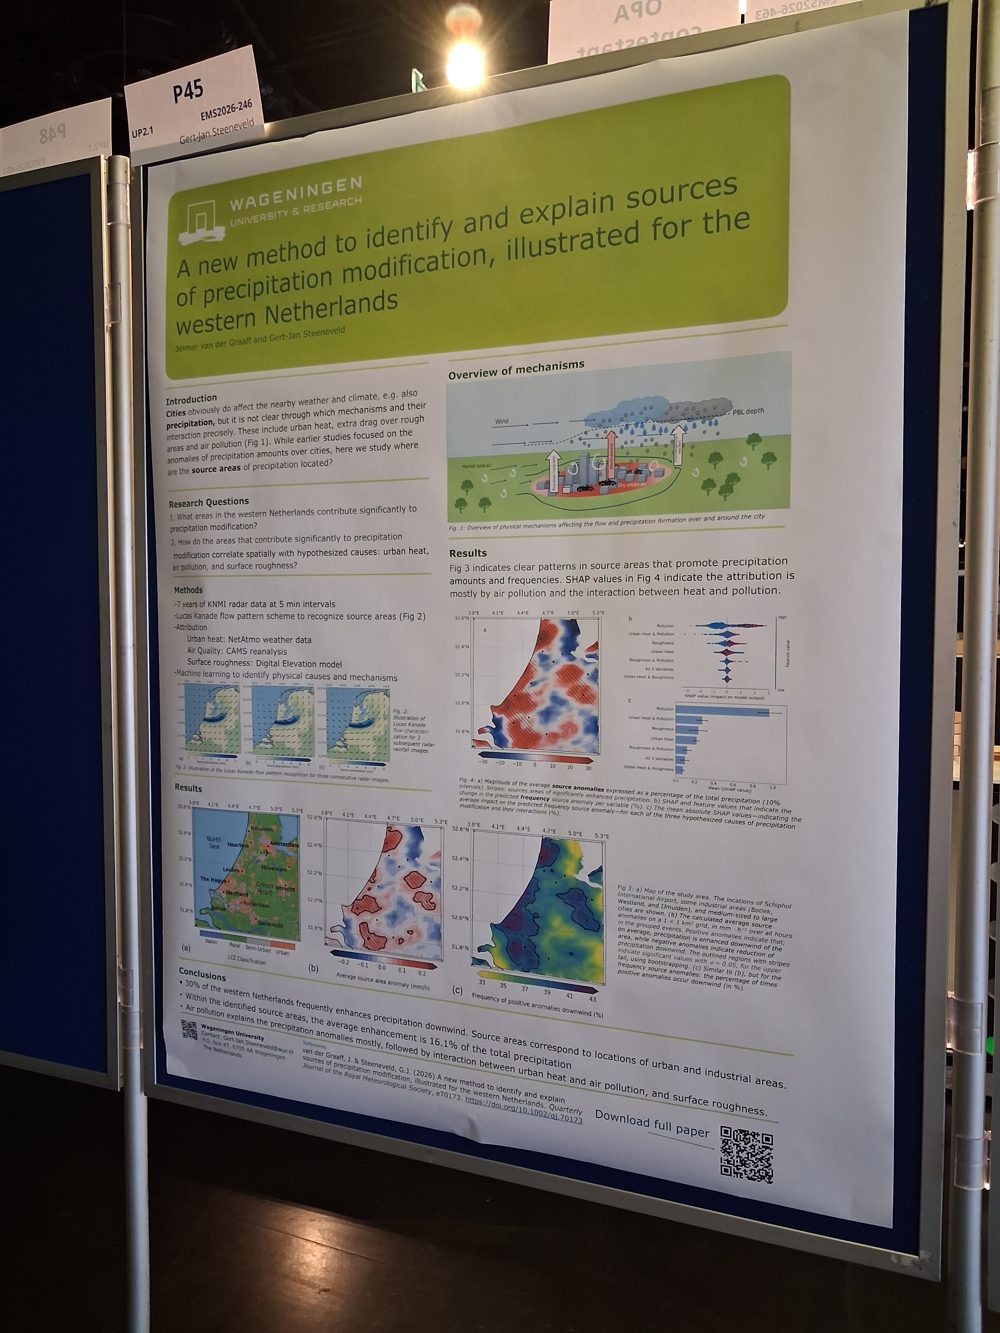
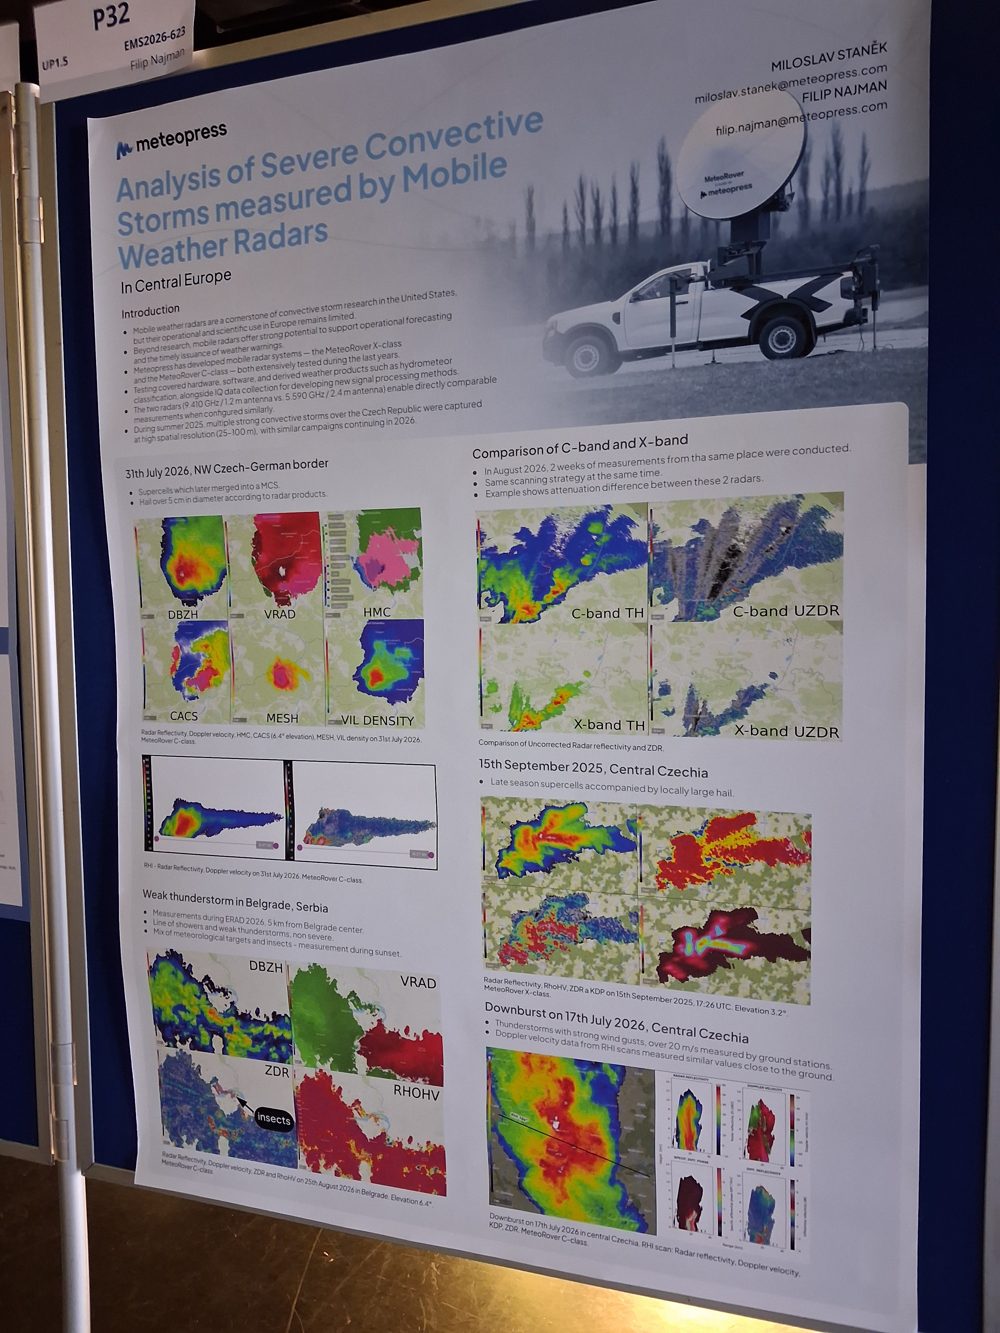
The posters I liked most either let the figures do most of the talking, or literally spelled out the main takeaway. My top three are below. The first went out of its way to annotate every figure. For the second, the presenter had drawn their own illustration and explained it really well when talking us through it. The third was so colourful, yet balanced and minimal, that it drew me straight in.

I’ve left mine below, so you can be the judge of it! I vibe-coded it in HTML after getting fed up with the rigid column sizing of every LaTeX template I had the displeasure of trying. It was handy because I could resize plots without having to manually rescale all the labels and text in Python.
Ol’ reliable PowerPoint is probably still the best and safest way to go, though. The University of Reading has a nice template and some tips.
The rise of Gen-AI and ML
I would say roughly a third of the talks I attended mentioned AI or ML in some form. It is HARD to keep up with all the fine-tuned, downscaled and multi-model forecasting systems. I did recognise Quantile Regression Forests and XGBoost, which were both popular.
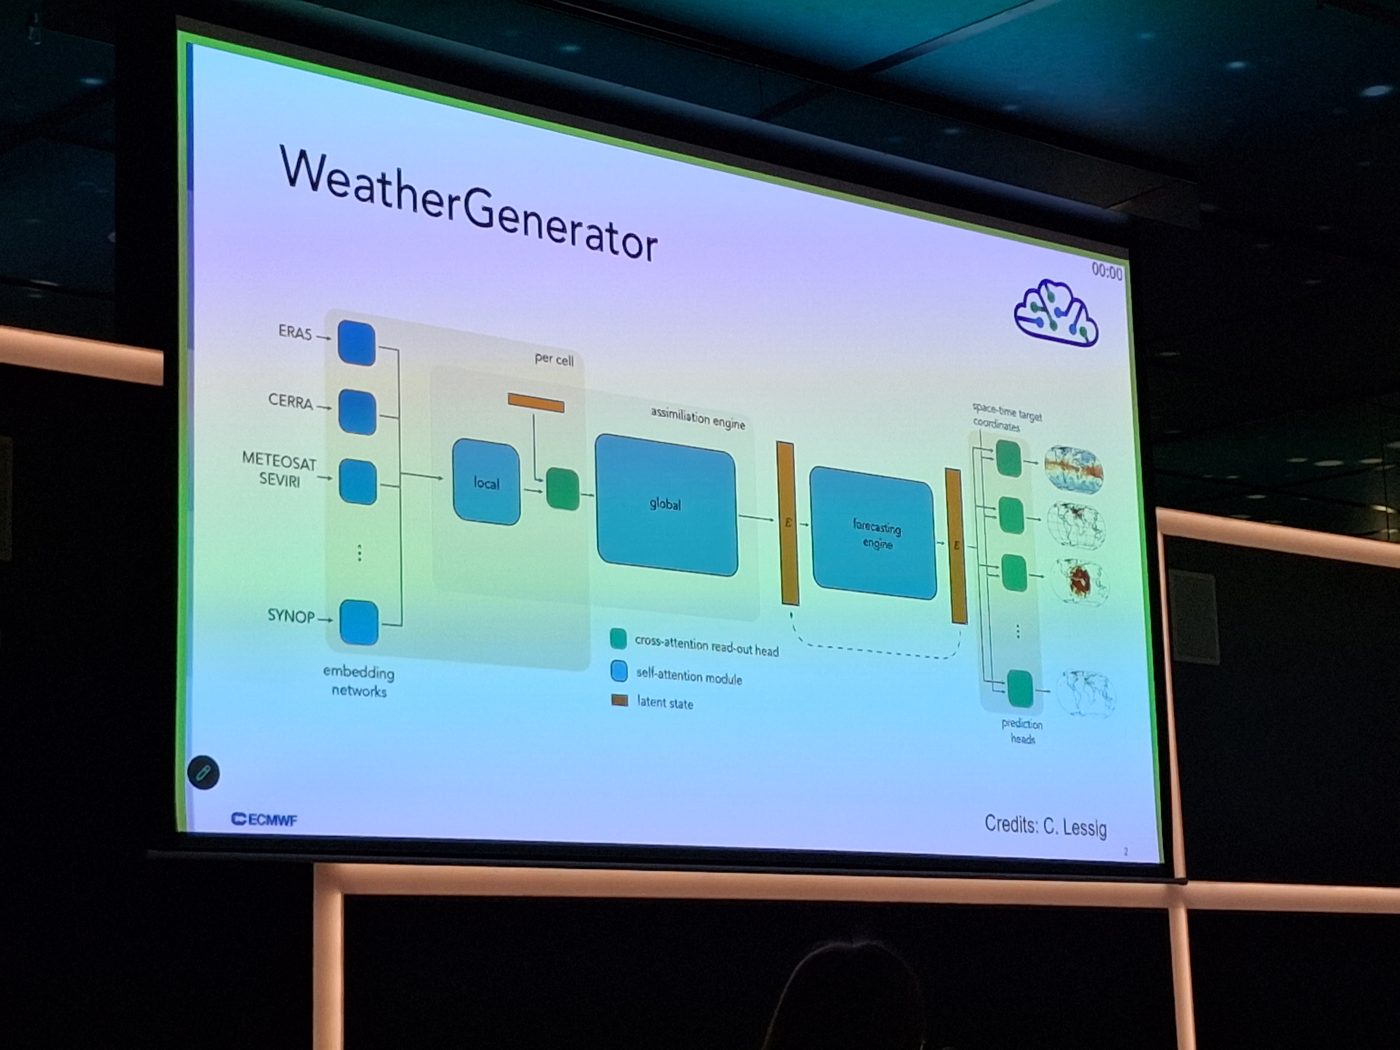
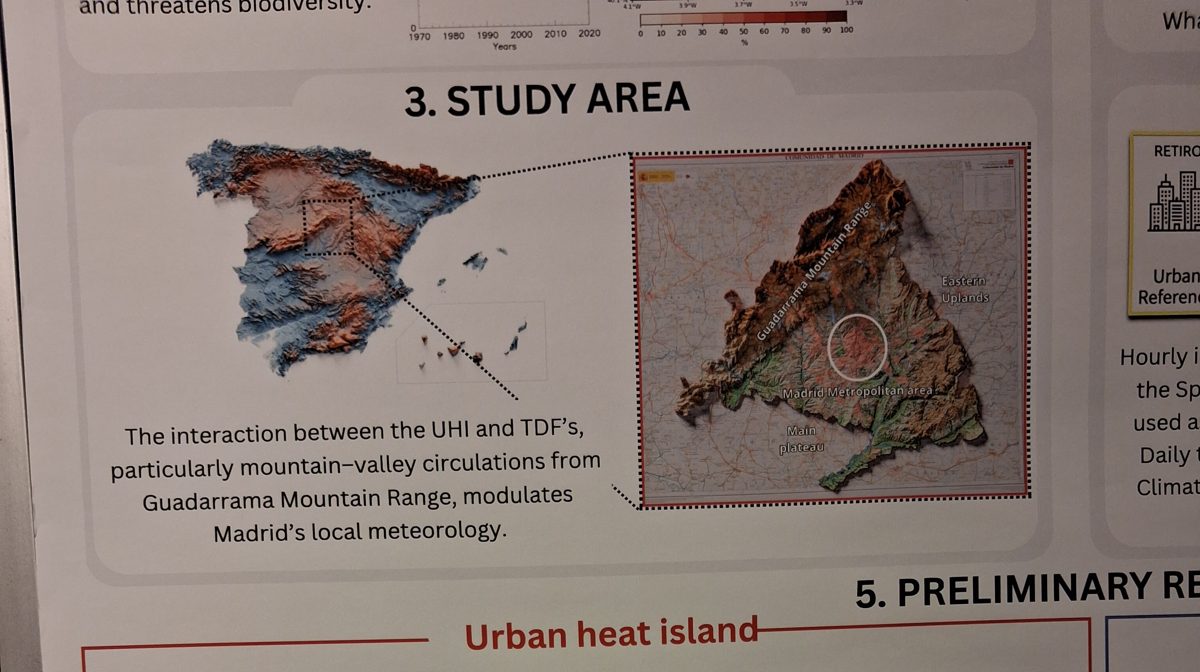
Gen-AI also made its way into plenty of slides and posters. Some had that very recognisable AI-infographic look, with lots of pills, but also obvious mistakes that nobody had caught before printing. In this one, the zoomed-in map literally doesn’t match the square it’s supposed to show. This image could have been made from actual data! It makes me question the researchers’ discretion in their own analysis and methods.
On the flipside, one speaker used an AI-generated image to illustrate Rossby waves, openly acknowledged it, and got a warm response from the audience.
Final Thoughts
All in all, my own poster was tedious to make, but it forced me to engage more deeply with my work and to put into words what makes science communication good (and make a blog post about it).
More like this
The second iScholars Ecosystem event, with broadcaster Jonathan McCrea.
Learning to Build with AI (+ a Sceptical Team)
A Maths & Stats evening at Lane 7.
Creation of a Break
A poem delivered as the closing speech at UCD's Maths and Statistics Postgraduate Workshop, May 2026.
Leave a comment